

My Custom Reports lets you design financial reports to suit your needs. This page includes all the KPIs (Key Performance Indicators) you need, and provides you with the tools to create reports with the KPIs you want included and how each report is laid out. All changes you make to your reports only impacts yourself. There is no risk of affecting other users in your organization, nor will anything you do here affect other CLEARVIEW pages. So go ahead and create that report you always wish you had access to.
There are two steps to building a custom report:
-
Creating a custom report layout: Refers to selecting the KPIs, organizing them the way you want and saving the layout.
-
Generating a custom report: Refers to selecting a report layout, and then selecting the parameters to display in the report.
Description
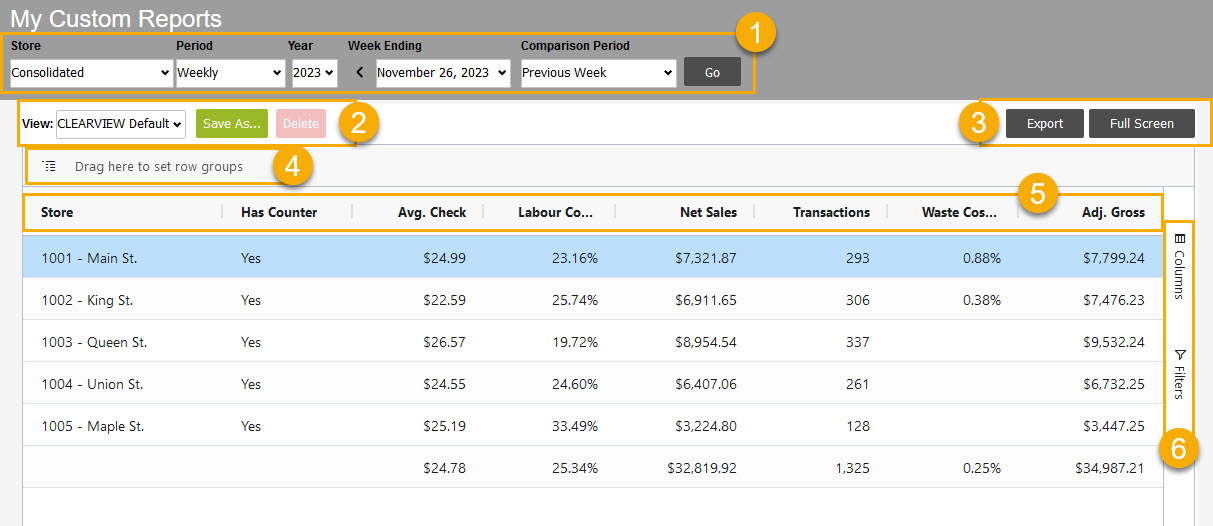
The following is a screenshot of the My Custom Reports page, with the different sections described below:
-
Parameter filters Drop-down boxes that let you select from the options available.: The filters Drop-down boxes that let you select from the options available. in this section allow you to select the data to be displayed in the report.
-
Report layout controls: Once you've created your report layout by including the KPIs you require and organizing it the way you want, you can control them using this section.
-
View: The View drop-down list includes the CLEARVIEW Default layout and all the custom report layouts that you have saved.
-
: The button provides you with options to save the custom report you've created.
Only the report layout is saved. The data displayed (based on the parameter filters Drop-down boxes that let you select from the options available. selected) will not be saved with the report layout. You will need to select the parameters each time you view a report.
-
: The button lets you delete the report you have selected.
-
-
and buttons:
-
Once you've generated your report, you can use the button to export the report displayed to MS Excel or another spreadsheet application.
-
Selecting Export to Excel will save the data as an .xlsx file that can be opened in MS Excel.
-
Selecting Export to CSV will save the data as an .csv file that can be opened by most spreadsheet applications.
-
-
The button removes the navigation bar The row of labels that are located at the top left corner of a page, below the Clearview logo. and the parameter filters Drop-down boxes that let you select from the options available., allowing you to see more data on your screen.
-
-
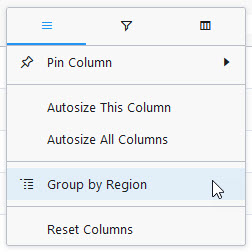
Row Groups: You can create additional data groups of KPIs by dragging groupable KPIs such as Region and City from the Report KPIs section to this section to allow you have a better view of how each category performs in that sector.
Only some KPIs are groupable. There are two way to determine whether a KPI is groupable:
-
 Click on
  next to a KPI in the Report KPIs section. If the KPI is groupable, you'll see an option to Group by KPI name.
 -
When you drag a KPI to this section, if
 appears next to the KPI, it is groupable. If
  appears next to the name of the KPI, it's ungroupable.
-
-
Report KPIs: The KPIs that were selected for the report layout are displayed as column headers here.
-
Side Bar:
-
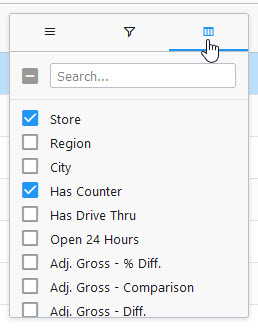
Columns: Click on Columns to see the complete list of KPIs, the grouped rows, and options for displaying the data for grouped rows.
-
The top portion of the Columns section is a complete list of KPIs available to you. You can add or remove KPIs from the report you're working on by placing a checkmark next to the KPI or removing the checkmark.
-
Some KPIs will only display data if a comparison period is selected.
-
A KPI followed by - Diff will provide you with the difference between the values for the Period selected when compared with the Comparison Period selected, for that KPI.
-
A KPI followed by - Comparison will provide you with the KPI values for the Comparison Period selected.
-
-
 KPIs can also be added and removed by hovering over any of the KPIs in the Report KPIs section, clicking on , then clicking on
  , and placing a checkmark or removing the checkmark from the boxes next to the KPIs, as needed.
-
-
Row Groups: This section displays the grouped KPIs and functions identical to the Row Groups section at the beginning of the report.
-
Values: This section lets you switch between the sum total or the average of each KPI, for the grouped KPIs.
EXAMPLE
If you've grouped the report data by region, you can select whether you want to view the total of a KPI (for example, the sum of the Net Sales of all restaurants in each region) or the average of the KPI (using the same example, the average Net Sales of all restaurants in each region).
The name of the aggregate KPI indicates whether it has been set to display the sum or average for that KPI. To switch between sum and average, simply click on the aggregate KPI and select whether you want to display the sum or average for that KPI. Clicking on the x on the right of a KPI will remove the aggregate function for that KPI from the report.
-
-
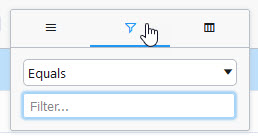
Filters Drop-down boxes that let you select from the options available.: Click on Filters to apply restrictions to the data displayed, based on the KPI values selected.
-
Click on a KPI to see the filter Drop-down boxes that let you select from the options available. options, and select from the options to view the filtered data in the report.
 You can also filter Drop-down boxes that let you select from the options available. a KPI by hovering over the KPI in the Report KPIs section, clicking on , then clicking on
  , and selecting from the filter Drop-down boxes that let you select from the options available. options provided.
-
-
Data Organization
There a plenty of ways that you can organize your data in the reports that you create.
-
Rows
-
Sort your data by clicking on the KPI, by which you want to sort, in the Report KPIs section.
 next to a KPI indicates that the data is sorted in ascending order for that KPI.
  next to a KPI indicates that the data is sorted in descending order for that KPI.
-
-
Columns
-
Click and drag a KPI along the Report KPIs section to rearrange the columns.
-
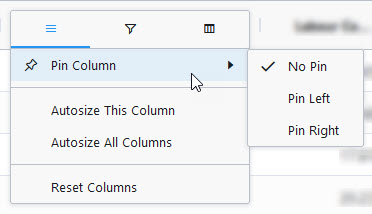 Click on , and then select from the options in Pin Column to force the KPI to stick to the left of the report, right of the report, or to unpin it.
 -
Click and drag on the divider on the right of a KPI to re-size the column.
You can also automatically size one or all the columns to display the full KPI name and reduce extra large columns. To do this click on
next to the KPI in the column that you want to automatically size, and then select Autosize This Column (or Autosize All Columns to automatically resize all columns).
Changes made to the organization of your data need to be saved to the report layout if you want your report to display that way each time you open it.
-
TO GENERATE A CUSTOM REPORT:
-
Open the My Custom Reports page.
-
Select the report layout that you want to use to generate the report from the View drop-down box.
-
Select the Region*, Store and periods for the report.
-
Click on the button.
TO CREATE A CUSTOM REPORT LAYOUT:
-
Open the My Custom Reports page.
-
Click on Columns on the right pane of the page.
-
Place a checkmark next to each of the KPIs you want to include in the report layout, and remove the checkmark for those that you don't want included.
-
Click and drag a KPI from the Report KPIs section to the either of the Row Groups sections, to group them by that KPI.
-
Switch between Sum and Average for the grouped KPIs using the Values section, as needed.
-
Organize your data the way you want (see Data Organization).
-
Click on the button.
-
Select New View to save the layout as a new one.
-
Enter a name for the layout.
-
Place a checkmark next to My Default View if you want to make the layout your default.
-
Click on the Save button.
TO EDIT A CUSTOM REPORT LAYOUT:
-
Open the My Custom Reports page.
-
Select the report you want to edit from the View drop-down list.
-
Make changes to the report as required.
-
Click on the button.
-
In the Save as... pop-up window:
-
Select Replace Existing.
-
Make sure the name of the report you're editing is in the box below.
-
Place a checkmark in the My Default View box if you want the report to open as the default report on the page.
-
Click on the button.
-
-
Open the My Custom Reports page.
-
Select the report you want to delete from the View drop-down list.
-
Click on the button.
-
Click on the button in the pop-up confirmation box.
*optional section or field that may or may not be visible depending on the settings selected, whether the supplier is integrated or not, etc.